Store event lineage by default
Plans, tool calls, observations, digests, and derived facts point back to their source events, so the memory graph stays auditable.
Agent run recorder
TraceBreak captures memory, execution, and replay as one linked event lineage, so teams can debug AI behavior with evidence instead of screenshots and guesswork.
Why it exists
Agent failures usually hide in the space between a prompt, a tool result, and the next model decision. TraceBreak makes that space a first-class trace.
Plans, tool calls, observations, digests, and derived facts point back to their source events, so the memory graph stays auditable.
The runtime records each step, each tool result, and each stop reason without turning the agent into a black-box framework.
Replay the same chain against a new model, prompt, or state and see the first step where behavior changes.
Live product shape
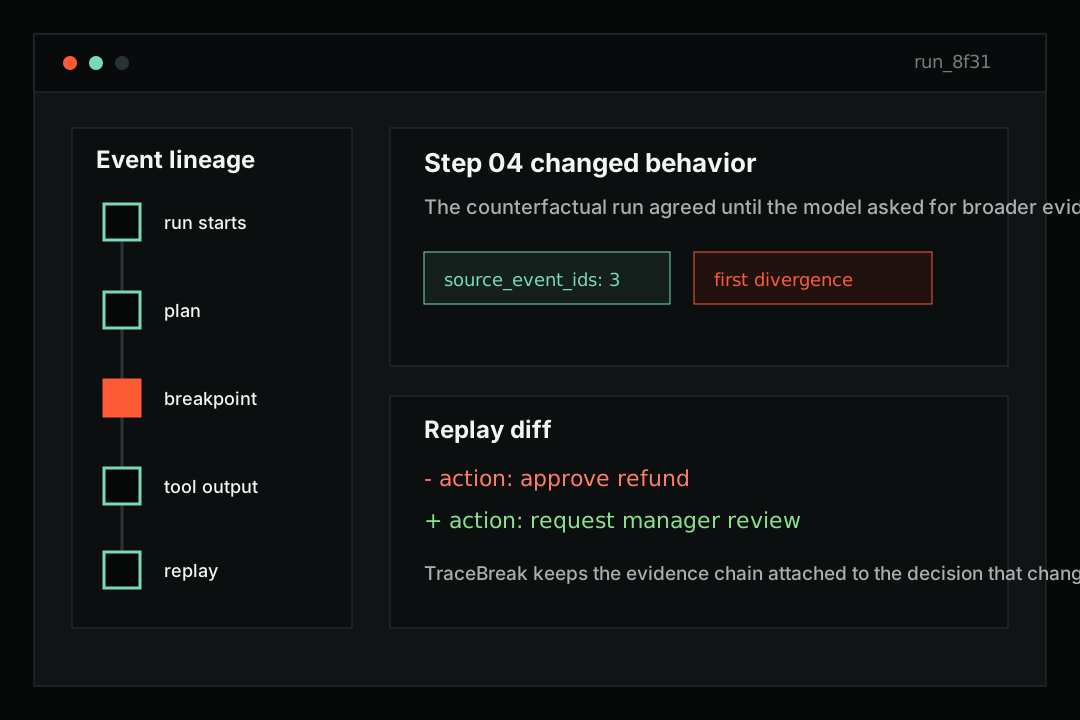
This is the core workflow: choose the run that failed, follow the event lineage, and compare the replay diff at the first changed decision.
- action: approve_refund
+ action: request_manager_review
One product
TraceBreak folds memory, runtime, and replay into one operational surface. The implementation can evolve underneath; the team debugging the run sees one product and one vocabulary.
Built for operators
TraceBreak is for teams shipping agentic workflows where a bad decision has to be explained, reproduced, and fixed.
Record each run as typed events with source links and tenant isolation.
Open a failed run and walk the decision tree from output back to evidence.
Run the same chain against a new model, prompt, or state snapshot.
Compare diffs, confirm the fix, and keep the trace attached to the incident.
Private beta
The fastest demo is a real failure: a hallucinated tool, a prompt drift, a loop, or a model swap that changed behavior.